OEE: How to Calculate Overall Equipment Effectiveness and What the Number Tells You
OEE is three numbers multiplied together: Availability, Performance and Quality. World-class OEE is 85%. Here is how each component is calculated, what drives each one, and how to use it to find the biggest loss.
By Hufsa17 October 20266 min read
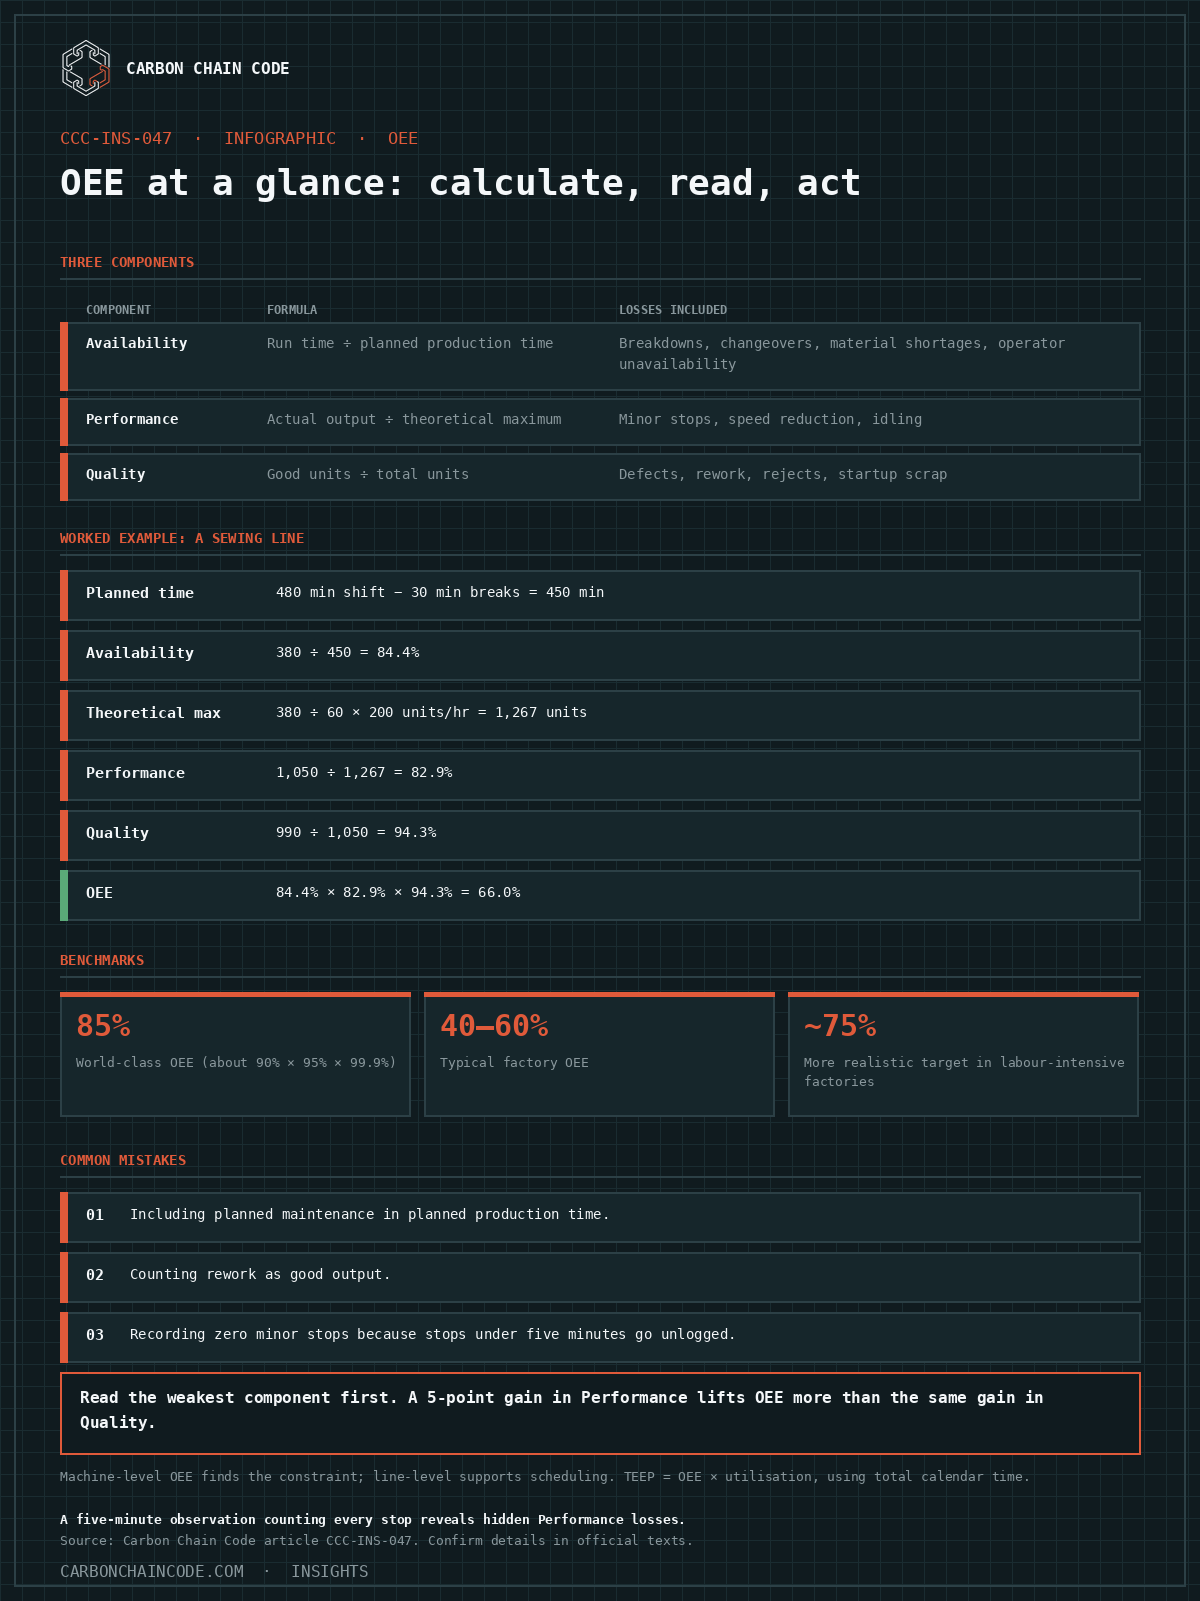
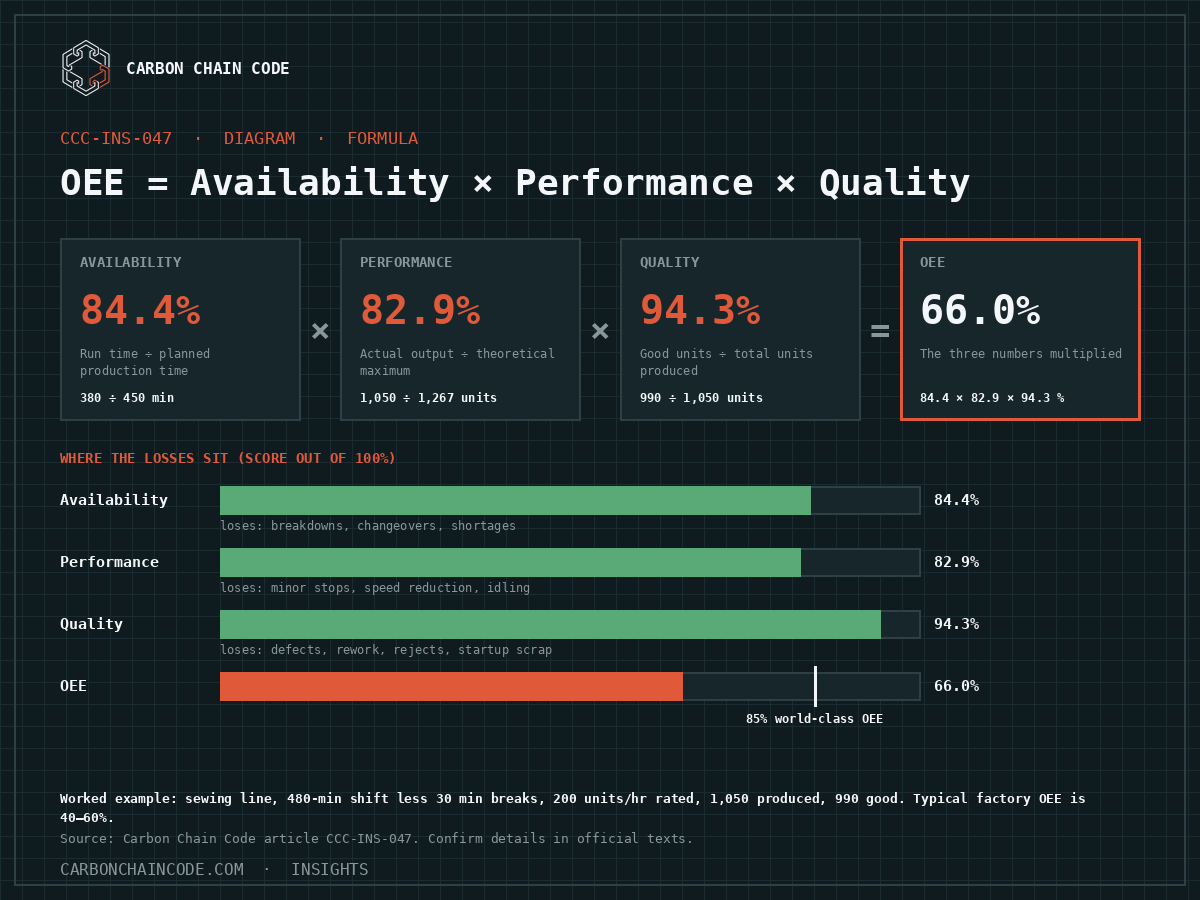
OEE — Overall Equipment Effectiveness — measures how much of planned production time is truly productive. The formula is: OEE = Availability × Performance × Quality. World-class OEE is widely cited as 85%, which corresponds to roughly 90% Availability × 95% Performance × 99.9% Quality. Most factories run between 40% and 60% OEE. The number is useful because it decomposes total loss into three separable causes.
The Three Components Defined
Component
Formula
What it measures
Losses included
Availability
Run Time ÷ Planned Production Time
Time the machine was actually running vs time it was scheduled to run
Breakdowns, changeovers, material shortages, operator unavailability
Performance
Actual Output ÷ Theoretical Maximum Output during Run Time
Speed at which the machine ran vs its rated speed
Minor stops (under 5 min), speed reduction, idling
Quality
Good Units ÷ Total Units Produced
Proportion of output that was right first time
Defects, rework, rejects, startup scrap
A Worked Example
Illustrative summary
A sewing line is scheduled for 480 minutes per shift. Planned breaks account for 30 minutes, leaving 450 minutes of Planned Production Time. The line ran for 380 minutes (70 minutes of breakdown and changeover). Availability = 380 ÷ 450 = 84.4%. The line's rated output is 200 units per hour. During 380 minutes of run time the theoretical maximum is 380 ÷ 60 × 200 = 1,267 units. Actual output was 1,050 units. Performance = 1,050 ÷ 1,267 = 82.9%. Of 1,050 units produced, 990 passed QC. Quality = 990 ÷ 1,050 = 94.3%. OEE = 84.4% × 82.9% × 94.3% = 66.0%.
Reading the Number: Where Is the Biggest Loss?
OEE is most useful not as a single target but as a diagnostic. Compare the three components: in the example above, Quality is the strongest component (94.3%) but Availability (84.4%) and Performance (82.9%) are both dragging the overall number. The first improvement target is Performance — a 5-point improvement there lifts OEE more than the same effort on Quality. Performance losses are often caused by unplanned minor stops that go unrecorded because they are shorter than the threshold for logging a breakdown. A five-minute observation of a machine in production, counting every stop however short, usually reveals these losses.
Common Mistakes in OEE Calculation
The most common errors: including planned maintenance time in Planned Production Time, which inflates the Availability loss and makes the machine look worse than it is; counting rework as good output (it is not — it went through the process twice, consuming machine time); and recording zero minor stops because operators do not log stops under five minutes. Each of these produces a misleading OEE that sends improvement effort in the wrong direction.
Frequently Asked Questions
Should OEE be measured per machine or per line?
Both are useful for different purposes. Machine-level OEE identifies which piece of equipment is the constraint. Line-level OEE gives an overall health metric for scheduling and capacity planning. In a line with a clear bottleneck machine, the line OEE will track closely to the bottleneck machine's OEE — improving anything other than the bottleneck will not improve line output.
How is OEE related to TEEP?
TEEP — Total Effective Equipment Performance — uses total calendar time instead of planned production time in the denominator. TEEP = OEE × Utilisation, where Utilisation is Planned Production Time ÷ Total Time. TEEP is a more demanding measure that reflects how much of all available time is productive, including time the machine is not scheduled to run.
Is 85% OEE actually achievable in a labour-intensive factory?
The 85% benchmark comes from automated or semi-automated discrete manufacturing. In a labour-intensive sewing or assembly factory, Availability and Performance are more sensitive to human factors — changeover management, training, fatigue — and 75% is a more realistic world-class target for many operations. The useful question is not whether you reach 85% but whether your OEE is trending upward and which component you are improving.
Need a CSRD gap analysis or hands-on implementation? Sustainability Frisk can help. www.sustainability-frisk.com
DMAIC is not a training exercise. Each phase has a defined output and a gate. Here is what each phase requires, what gets produced, and where most factory projects stall.
ISO 14001 tells you to set an environmental objective. Six Sigma's DMAIC gives you a structured method to reach it. Here is how each phase maps to a Scope 1 and Scope 2 carbon reduction project, with an illustrative worked example.
 Carbon Chain Code