Six Sigma DMAIC on the Factory Floor: What Each Phase Produces
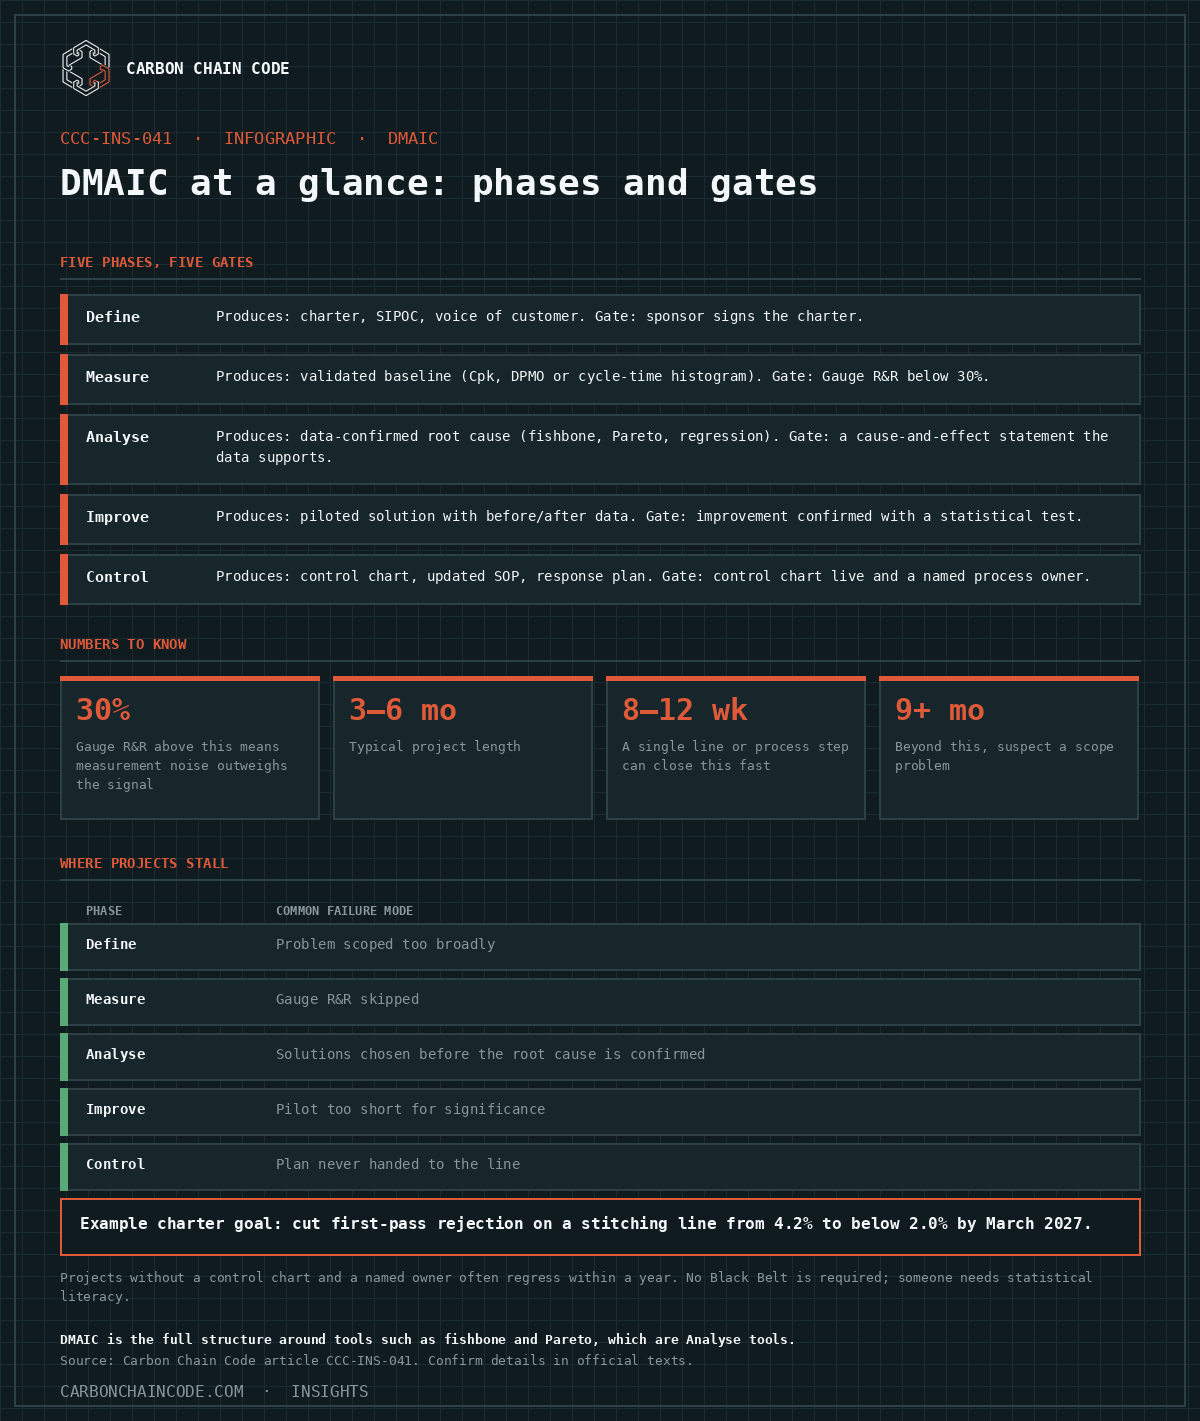
DMAIC is not a training exercise. Each phase has a defined output and a gate. Here is what each phase requires, what gets produced, and where most factory projects stall.
By Hufsa17 October 20267 min read
DMAIC — Define, Measure, Analyse, Improve, Control — is the structured problem-solving method used in Six Sigma. Each phase ends with a toll-gate review before the project moves forward. The method works on any measurable process, from defect rate to energy consumption to supplier lead time. Most projects fail in Measure or slip past Control without locking the gains.
What Is DMAIC and When Does It Apply?
DMAIC applies when you have a process that already exists and a measurable problem with it — a defect rate above target, a process that takes too long, a yield that is below standard. It does not apply when you are designing something new; that is DMDFSS or DMADV. You also need baseline data: if you cannot measure the current state, you cannot know whether the improvement worked.
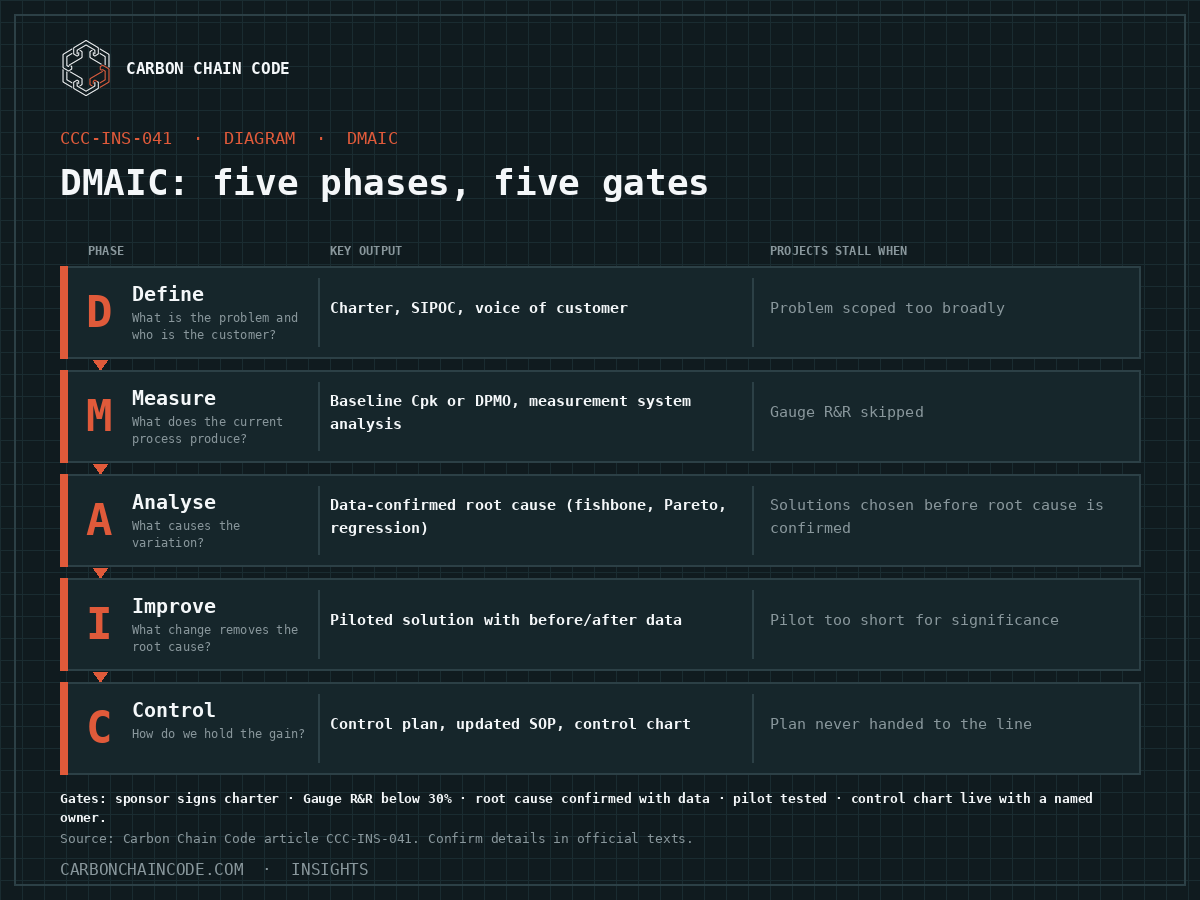
Phase
Core question
Key output
Common failure mode
Define
What is the problem and who is the customer?
Project charter, SIPOC, voice of customer
Problem defined too broadly to solve in one project
Measure
What does the current process produce?
Baseline Cpk or DPMO, measurement system analysis
Data collected but measurement system not validated (Gauge R&R skipped)
Analyse
What causes the variation?
Root cause confirmed with data — fishbone, Pareto, regression
Team jumps to solutions before root cause is confirmed
Improve
What change eliminates the root cause?
Piloted solution with before/after data
Pilot run too short to show statistical significance
Control
How do we hold the gain?
Control plan, updated SOP, control chart
Control plan written but not handed to the line — project closes and gains drift back
Define: What the Charter Must Actually Contain
Illustrative summary
The project charter is not a slide deck title. It must state the problem in measurable terms — not 'reduce defects' but 'reduce the first-pass rejection rate on the stitching line from 4.2% to below 2.0% by March 2027'. It names the process start and stop point (scope), the business case (what the defect rate costs in rework, scrap and customer returns), the team, the project sponsor, and the timeline. A SIPOC — Suppliers, Inputs, Process, Outputs, Customers — maps who touches the process and what flows through it. The Define gate is passed when the sponsor has signed the charter.
Measure: Gauge R&R Is Not Optional
Before you trust any data, you need to know whether your measurement system is capable of detecting the variation you care about. Gauge Repeatability and Reproducibility (Gauge R&R) tests whether two operators measuring the same part get the same number, and whether the same operator gets the same number on two separate readings. A Gauge R&R result above 30% means the measurement system is contributing more noise than signal. Data collected with a bad gauge will generate a false root cause. The Measure phase output is a validated baseline: a Cpk value, a DPMO, or a cycle-time histogram, produced with a measurement system you have confirmed works.
Analyse: Correlation Is Not Cause
The Analyse phase uses data to narrow from the long list of potential Xs (causes) to the vital few that actually drive the Y (output). Tools include a fishbone diagram for brainstorming, a Pareto chart for ranking frequency, a scatter plot or regression for quantifying the relationship, and a hypothesis test to confirm whether a difference is real or noise. The gate test is: can you write a clear statement of cause and effect supported by data? Teams that skip this and jump straight to improvement often fix the wrong thing and are back to the same defect rate six months later.
Improve and Control: Pilot Before You Deploy
The Improve phase designs a solution targeted at the confirmed root cause, pilots it on a limited scope with before/after measurement, and uses a statistical test to confirm the improvement is real. The Control phase then builds the system that prevents the process from drifting back — a control chart with defined reaction rules, an updated standard operating procedure, and a response plan if the chart signals. Projects that close without a control chart and a named process owner almost always regress within a year.
DMAIC gate checklist
Define: Charter signed by sponsor with a measurable problem statement, SIPOC complete, team named.
Measure: Gauge R&R run and result below 30%, baseline metric calculated from real data.
Analyse: Root cause confirmed with data — not assumed from experience.
Improve: Pilot run with before/after data and a statistical test showing the improvement is real.
Control: Control chart live on the line, SOP updated, process owner named.
Frequently Asked Questions
How long does a DMAIC project take?
A typical factory DMAIC project runs three to six months from charter to close. Projects that run longer than nine months usually have a scope problem — the Y is too broad or the team is part-time. A well-scoped project on a single line or process step can close in eight to twelve weeks.
Does a factory need a Black Belt to run DMAIC?
No, but someone on the team needs statistical literacy — enough to run a Gauge R&R, read a control chart and interpret a hypothesis test. A Green Belt or an experienced engineer can lead most factory DMAIC projects. A Black Belt is most useful for complex problems with multiple interacting Xs.
How is DMAIC different from just using a fishbone and a Pareto chart?
A fishbone and a Pareto are two tools in the Analyse phase. DMAIC is the full structure that defines the problem rigorously before you start, validates the measurement system before you collect data, confirms root cause with data rather than opinion, and installs a control system to hold the gain. The tools only work if the phases around them are followed.
Need a CSRD gap analysis or hands-on implementation? Sustainability Frisk can help. www.sustainability-frisk.com
ISO 14001 tells you to set an environmental objective. Six Sigma's DMAIC gives you a structured method to reach it. Here is how each phase maps to a Scope 1 and Scope 2 carbon reduction project, with an illustrative worked example.
OEE is three numbers multiplied together: Availability, Performance and Quality. World-class OEE is 85%. Here is how each component is calculated, what drives each one, and how to use it to find the biggest loss.
 Carbon Chain Code