 Carbon Chain Code
CCC-SUS-006Sustainability/ESG
CSRD for Suppliers: Guide + Response Workbook
Practical CSRD guide and Excel workbook for manufacturers answering EU customer sustainability requests. Value chain cap, Annex II decoder, reply templates.
ISO 14001 tells you to set an environmental objective. Six Sigma's DMAIC gives you a structured method to reach it. Here is how each phase maps to a Scope 1 and Scope 2 carbon reduction project, with an illustrative worked example.

ISO 14001:2015 Clause 6.2 requires an organisation to establish environmental objectives and plan how to achieve them. It does not prescribe a methodology. Six Sigma's DMAIC framework (Define, Measure, Analyze, Improve, Control) is a data-driven approach that applies directly to emissions reduction in a manufacturing facility. Used together, ISO 14001 provides the governance structure (what you must do) and DMAIC provides a method for doing it systematically. This article covers each DMAIC phase for a Scope 1 and Scope 2 carbon reduction project and includes an illustrative worked example with fictional data.
Most factory carbon reduction programmes stall at two points: baseline measurement (too aggregated to act on) and solution selection (too many options, no rigorous ranking). DMAIC structures the project to avoid both. The Measure phase forces specificity — you cannot improve what you cannot measure at the unit of production. The Analyze phase forces root cause identification before solution selection, which prevents the common error of implementing energy-efficiency measures that address symptoms rather than the primary drivers of emissions.
The difference between an ISO 14001 environmental objective and a DMAIC carbon project is not that one is more rigorous, because ISO 14001 implemented well is rigorous. The difference is that DMAIC brings a specific toolkit (process maps, measurement system analysis, fishbone diagrams, hypothesis testing, control charts) that many EHS teams do not use in their standard practice. Using DMAIC as the method inside your ISO 14001 objectives gives you evidence an auditor can follow.
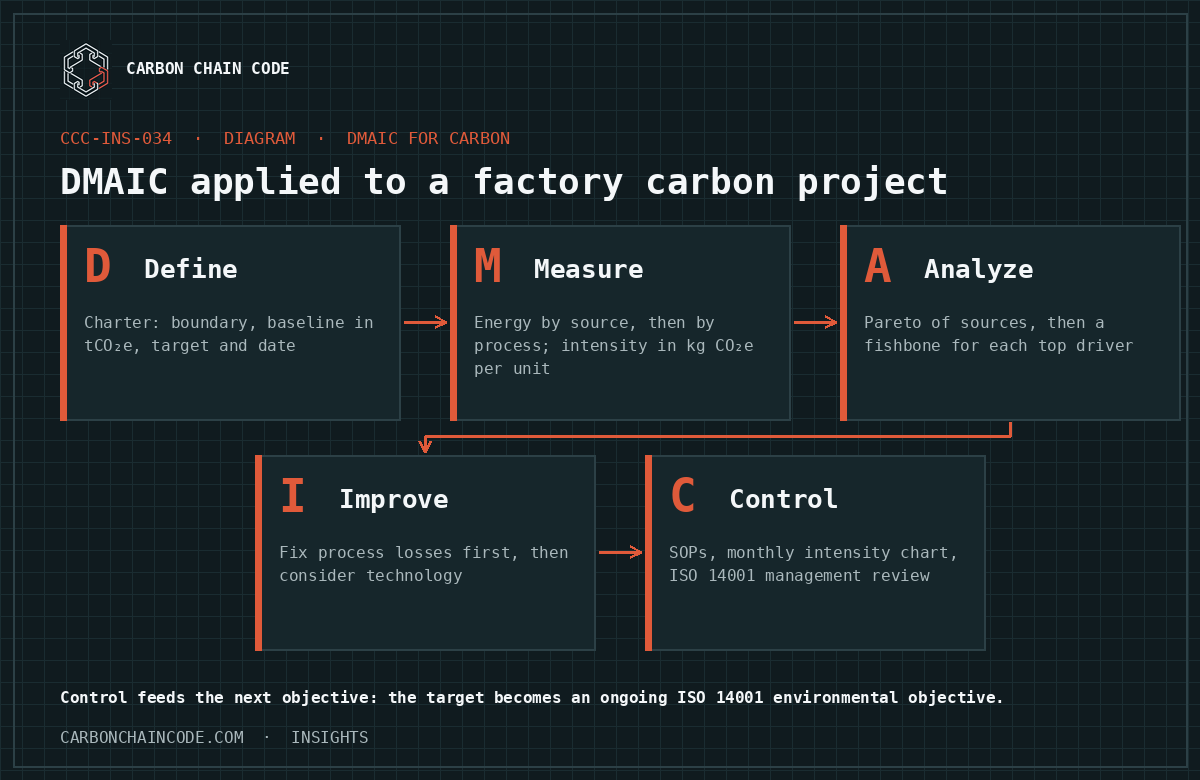
The Define phase establishes what you are trying to achieve and where. For a carbon reduction project, the critical decisions in this phase are organisational boundary (which facilities, which legal entities) and reporting boundary (Scope 1 only, or Scope 1 and Scope 2). For most factory-level projects, the boundary is a single site and the scope covers: Scope 1 (direct combustion — natural gas, fuel oil, diesel generators, steam boilers) and Scope 2 location-based (purchased electricity, using the national grid emission factor).
The project charter should include: a baseline GHG figure for the most recent full calendar year (in tCO₂e), a target reduction (expressed as an absolute tCO₂e figure or a percentage reduction from baseline), a target date, and the project team and their roles. The charter is the Define deliverable — without an agreed baseline and target, the project has no measurable objective, which is a gap both under ISO 14001 Clause 6.2 and under any external assurance review.
The Measure phase is where many factory carbon projects succeed or stall. A facility-level total, such as 2,400 tCO₂e for the year, is not actionable. To improve, you need emissions at process or product level. That means breaking the facility total down by energy source, then by production process or product category, then by time period (monthly or weekly).
| Energy source | Data source | Emission factor source |
|---|---|---|
| Grid electricity | Monthly utility bills (kWh) | Published national grid factor for your reporting year (national regulator or an international database); document the year and source |
| Natural gas | Monthly gas bills or meter readings (m³ or MJ) | Default factors from the IPCC 2006 Guidelines or your national regulator; document the source |
| Fuel oil / diesel | Fuel purchase records (litres) | IPCC 2006 Guidelines default factors or national regulator default |
| Steam (purchased) | Steam meter readings (tonnes or GJ) | Supplier-provided emission factor or calculated from fuel mix |
| LPG | Purchase records (kg) | IPCC 2006 Guidelines default factors or national regulator default |
The Measurement System Analysis (MSA) step in manufacturing DMAIC is about verifying that your measurement system is reliable. For a GHG project, this means checking that your energy meters are calibrated, that billing data matches meter readings, and that the emission factors are the right vintage for your reporting year. A 2023 grid factor applied to a 2026 baseline silently introduces error. Record the version and source of each factor you used. Use GWP values from a stated IPCC assessment report (for example AR6) and say which one.
The Analyze phase distinguishes a DMAIC project from a standard energy audit. Where an energy audit identifies high-consumption areas, DMAIC uses structured root cause analysis to identify why those areas consume what they consume. The primary tool is the Ishikawa (fishbone) diagram, structured around the six-M categories adapted for a carbon context: Machines (equipment efficiency, age, maintenance status), Methods (process temperatures, run times, batch sizes), Materials (input energy content, auxiliary chemical heating requirements), Man (operator practice, start-up and shutdown procedures), Measurement (meter accuracy, billing cycle alignment), and Environment (ambient temperature effects on process requirements).
In the author's experience of sportswear and sporting-goods factories, the Analyze phase often points to a small number of sources: steam generation for setting and washing, compressed air leakage, and diesel generators running during grid outages. The root causes are rarely "we use too much gas". They are specific: steam pressure set above process requirement, condensate return not working, compressed air lines with unmaintained fittings, generator run-time not minimised during partial grid restoration. Each is a specific process problem that can often be fixed without major capital investment.
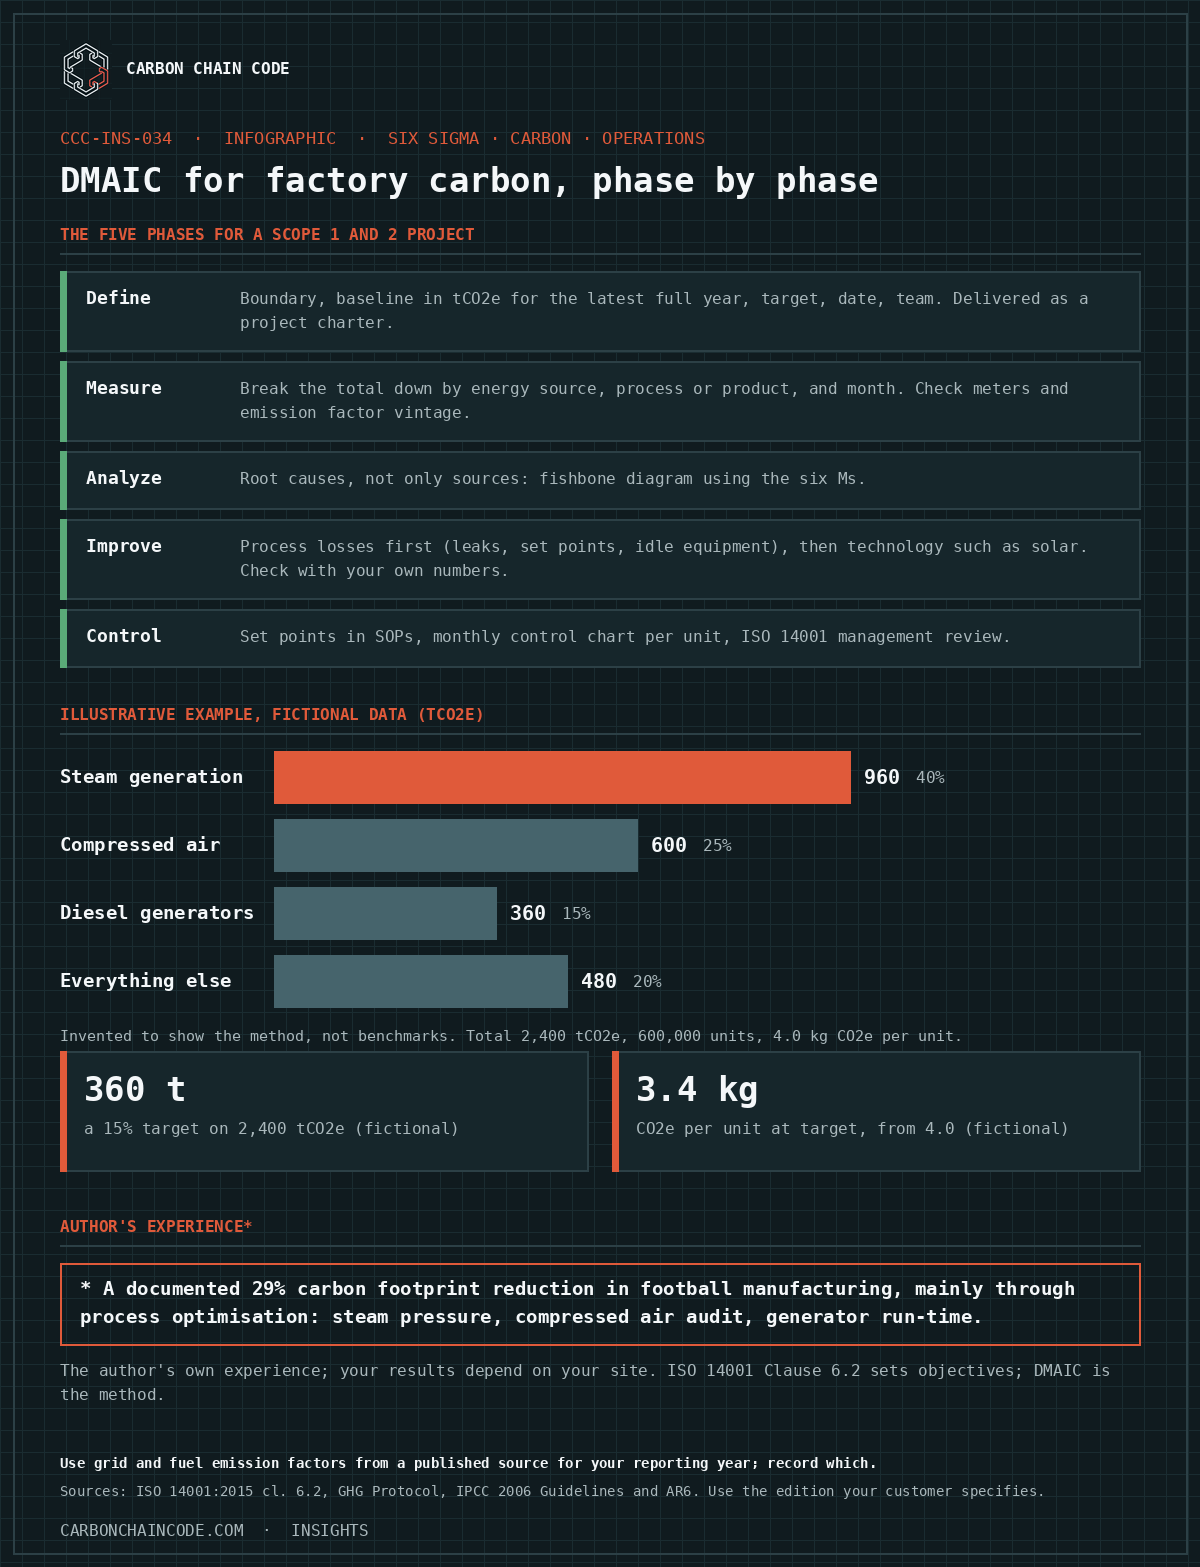
A fictional factory emits 2,400 tCO₂e in its baseline year and produces 600,000 units. Its intensity is 2,400 tCO₂e ÷ 600,000 units = 0.004 tCO₂e per unit, or 4.0 kg CO₂e per unit. The Analyze phase produces this Pareto breakdown. These figures are invented to show the method, not benchmarks.
| Source of emissions | tCO₂e | Share of total |
|---|---|---|
| Steam generation | 960 | 40% |
| Compressed air (electricity) | 600 | 25% |
| Diesel generators | 360 | 15% |
| Everything else | 480 | 20% |
| Total | 2,400 | 100% |
The top three sources account for 80% of emissions, so the team builds a fishbone diagram for each. Suppose the charter sets a 15% reduction target. That is 0.15 × 2,400 = 360 tCO₂e, giving 2,040 tCO₂e. At the same output of 600,000 units, the target intensity is 2,040 ÷ 600,000 = 0.0034 tCO₂e per unit, or 3.4 kg CO₂e per unit. Tracking intensity as well as the absolute figure matters because output changes from month to month.
The Improve phase generates and selects solutions. A common mistake is to jump to solar panels or energy efficiency certifications before addressing the process losses found in the Analyze phase. Solar adds supply-side clean energy but does nothing to reduce waste in the system, such as compressed air leaks, excessive steam pressure and idle equipment. Process losses are usually worth addressing first because they tend to cost less and pay back faster than new technology, but check this with your own numbers.
From the author's work on football (soccer ball) manufacturing, a documented 29% carbon footprint reduction was achieved mainly through process optimisation, not major capital investment. The main measures were steam pressure optimisation on the vulcanisation process, a compressed air audit and leak repair programme, and a protocol to minimise diesel generator run-time during partial grid restoration. The principle is process optimisation before technology substitution. Your results will depend on your site, so set your own baseline and target in the Define phase.
The Control phase is where many carbon reduction projects fail to sustain their gains. A reduction achieved during Improve needs to be locked into the management system, not stored as project memory. The control tools are updated operating procedures (steam pressure set points documented in SOPs, not in the project team's heads), control charts for monthly energy consumption per unit of production (so deviations are visible before they build into a regression), and integration into the ISO 14001 management review, where the reduction target becomes an ongoing environmental objective monitored quarterly.
Football manufacturing example: 29% carbon footprint reduction documented by the author. Illustrative example in this article: 2,400 tCO₂e baseline, 600,000 units, 4.0 kg CO₂e per unit, 15% target gives 3.4 kg CO₂e per unit (fictional data). ISO 14001 Clause 6.2 sets the objectives; DMAIC is the method for reaching them. For a customer's Scope 3 Category 1 reporting, supplier-specific data is typically factory Scope 1 and Scope 2 emissions allocated to the product. Always use grid and fuel emission factors from a published source for your reporting year.
The DMAIC Carbon Project Checklist
ISO 14001:2015, clause 6.2 (environmental objectives and planning to achieve them). GHG Protocol Corporate Standard and Scope 3 Standard (Category 1: purchased goods and services). IPCC 2006 Guidelines for National Greenhouse Gas Inventories (default fuel emission factors) and IPCC Sixth Assessment Report (global warming potentials). Use the edition your customer or reporting framework specifies.
No. The DMAIC phases are a structured problem-solving framework, not a statistical certification requirement. A factory team with a quality or EHS manager comfortable with process mapping, data analysis, and root cause techniques can run a basic DMAIC carbon project. Where Six Sigma tools become valuable is in the Analyze phase — particularly for complex multi-variable problems where it is not obvious which process driver has the largest carbon impact. For simpler projects (one facility, two or three energy sources), the structured approach without the advanced statistics is sufficient.
ISO 50001 is a management system standard for energy — it has a structure similar to ISO 14001 but focused on energy performance. DMAIC is a project methodology. They are complementary: ISO 50001 provides the governance and continuous improvement framework, DMAIC provides the analytical toolkit for specific improvement projects within that framework. A factory with ISO 14001 but not ISO 50001 can still run an effective DMAIC carbon project — the ISO 14001 Clause 6.2 objective structure provides sufficient governance.
The primary output of the Measure phase — factory-level Scope 1 and Scope 2 in tCO₂e divided by units of production — is exactly the data that EU brand customers need for their GHG Protocol Scope 3 Category 1 calculation. A factory running a DMAIC carbon project builds the primary data infrastructure that replaces the brand's spend-based Scope 3 estimate with a supplier-specific figure. This is the intersection between an internal improvement project and an external compliance requirement.
Free tool · Sustainability Frisk
FREE TOOL FROM SUSTAINABILITY FRISK
The Carbon Footprint Calculator walks you through Scope 1 and Scope 2 from energy records to a per-unit figure you can share with customers.
Need a CSRD gap analysis or hands-on implementation? Sustainability Frisk can help. www.sustainability-frisk.com
Practical CSRD guide and Excel workbook for manufacturers answering EU customer sustainability requests. Value chain cap, Annex II decoder, reply templates.
Most ISO 14001 preparation focuses on building the documentation. Auditors focus on something different: whether your system actually works. A TÜV-certified Lead Auditor explains the six things that determine your certification outcome.
Most brands still estimate the emissions of their factories from spend data. This guide explains why that is changing, what brands will ask suppliers for, and what a factory can measure now from records it already has.