Cutting a Textile Mill's Emissions by About 20%: A Worked Example
An illustrative model, not a real case, of five common factory measures, with the arithmetic shown so you can replace the assumptions with your own data.
By Hufsa8 October 20266 min read
This article is a worked example, not a report on a real factory. An earlier version described a "composite" mill that cut emissions by 31% in 18 months and listed customer and financing outcomes as if they had happened. Several of its figures also did not add up, so I rebuilt it as a model with assumptions stated openly. Use it to see how the arithmetic works, then replace each assumption with your own data.
The Assumed Factory
Assumption
Value
Product
Woven synthetic fabric, about 450 employees
Electricity use
4,000,000 kWh a year
Grid emission factor
0.50 kg CO₂ per kWh (assumed; use your national factor)
Electricity price
$0.10 per kWh (assumed)
Natural gas to boilers and process
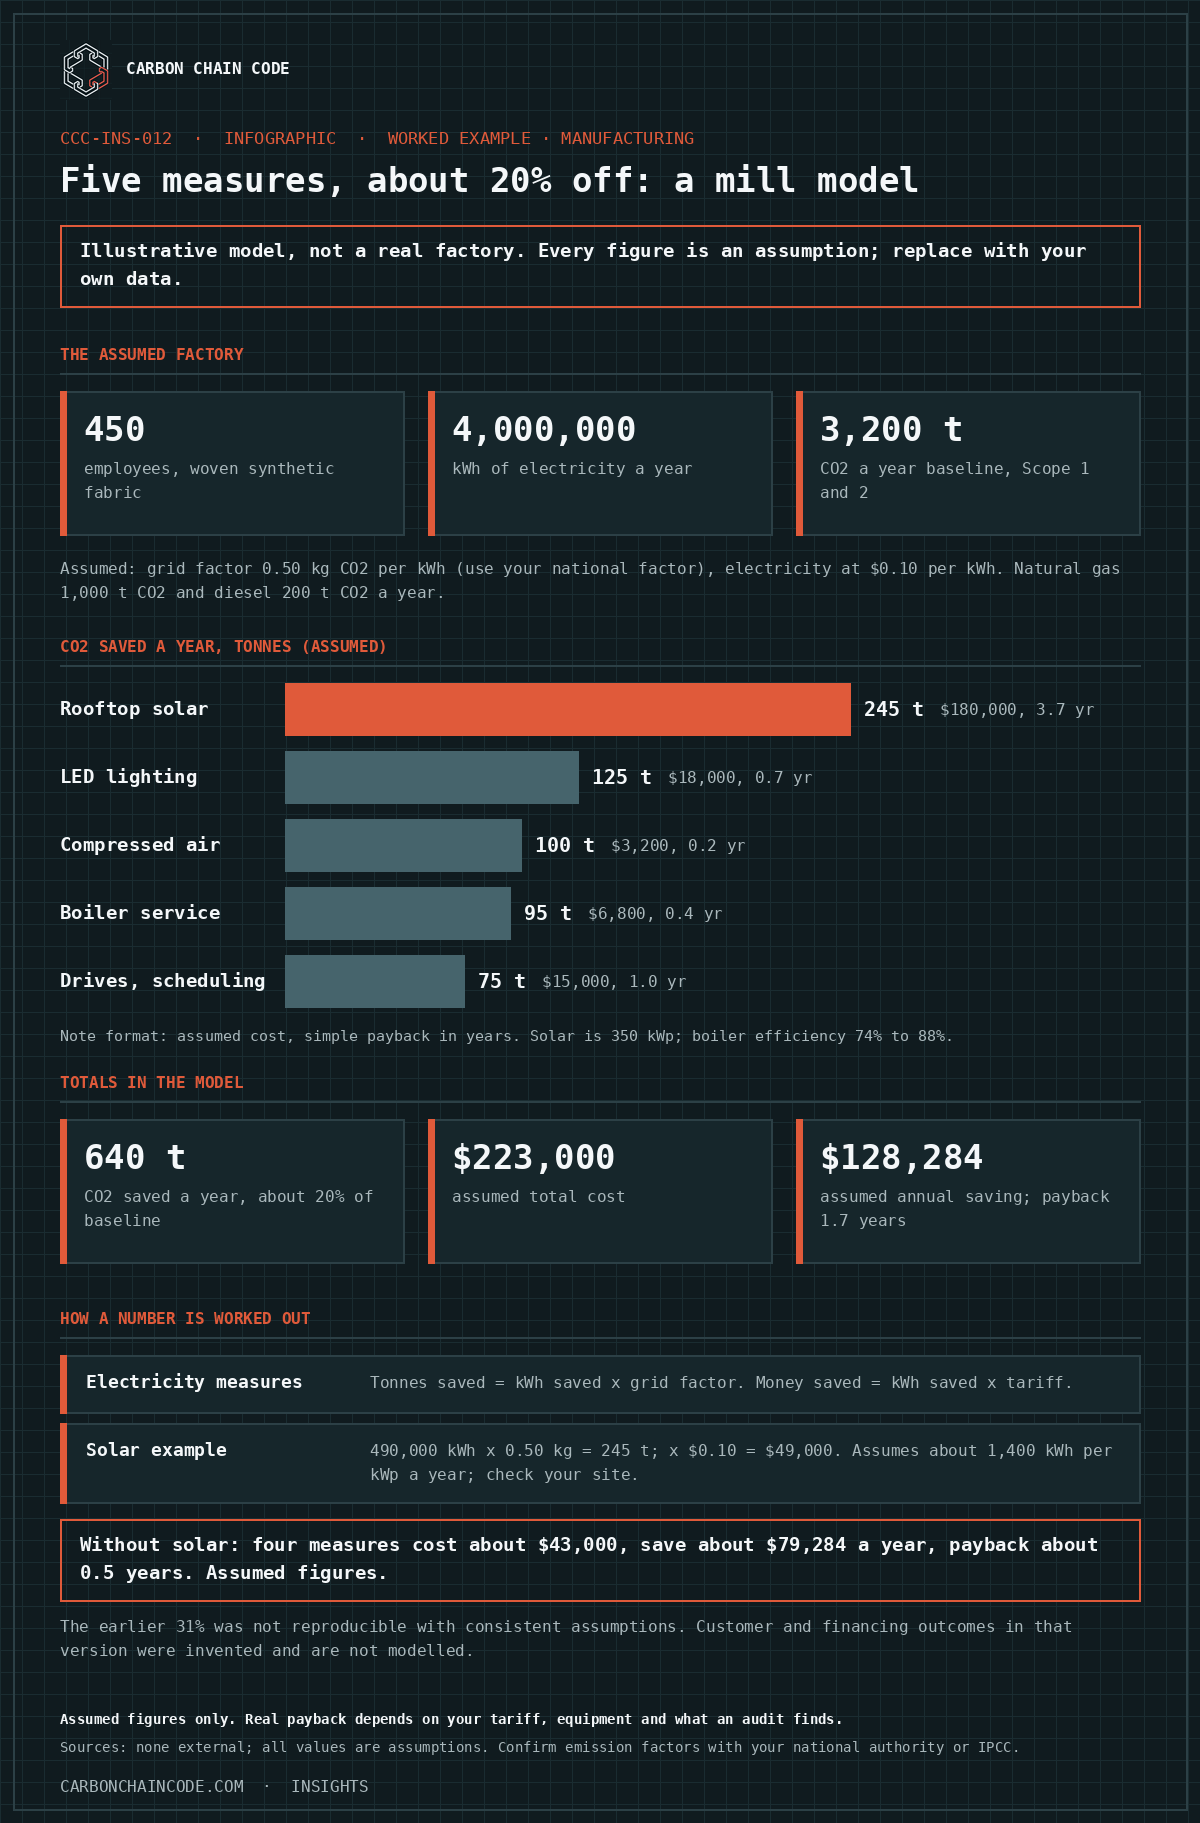
1,000 t CO₂ a year
Diesel for backup generator
200 t CO₂ a year
Baseline, Scope 1 and 2
3,200 t CO₂ a year
Five Measures
Illustrative summary
Measure
CO₂ saved a year
Assumed cost
Assumed annual saving
Simple payback
LED lighting in finishing and warehouse
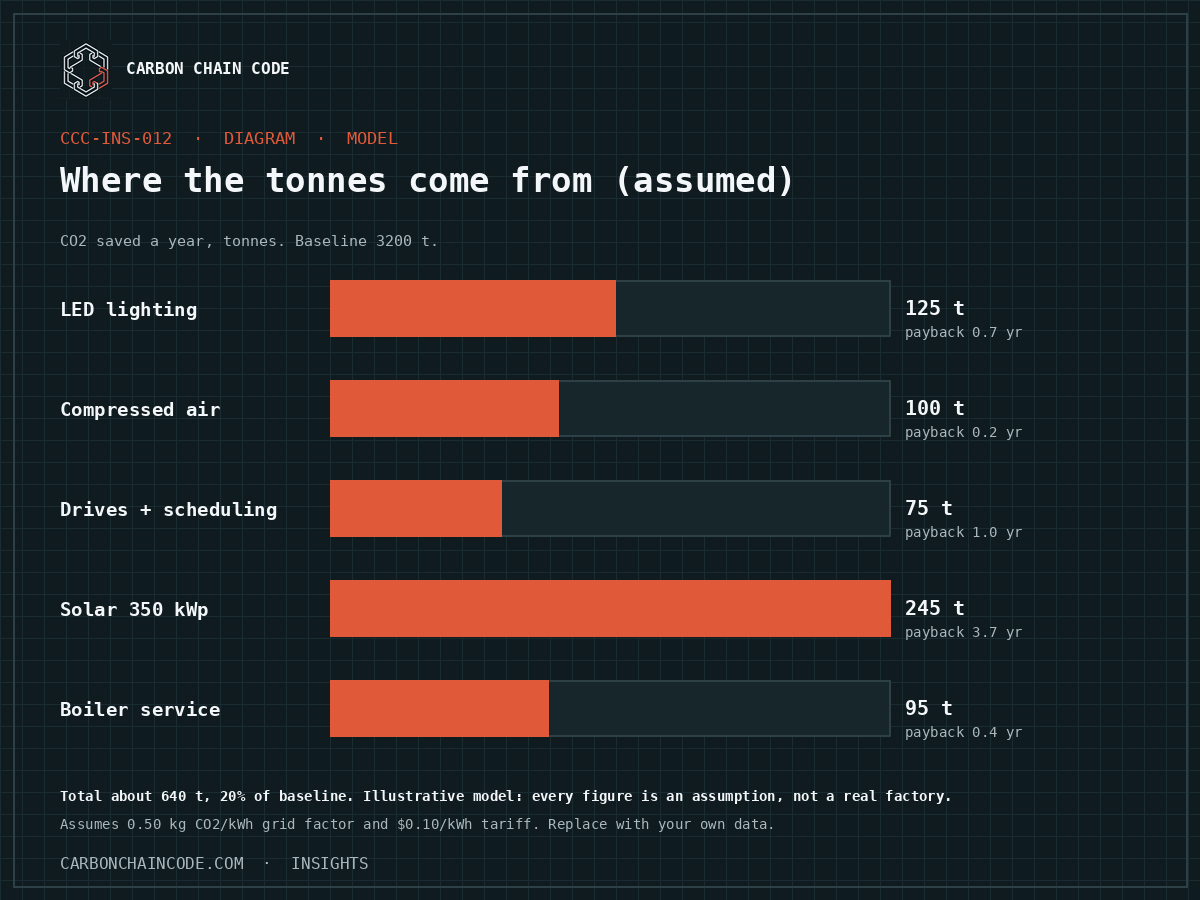
125 t
$18,000
$25,000
0.7 years
Compressed air audit and leak repair
100 t
$3,200
$20,000
0.2 years
Variable speed drives and shift scheduling (idling)
75 t
$15,000
$15,000
1.0 years
Rooftop solar, 350 kWp
245 t
$180,000
$49,000
3.7 years
Boiler service and economiser, 74% to 88% efficiency
95 t
$6,800
$19,284
0.4 years
Total
640 t
$223,000
$128,284
1.7 years
Under these assumptions the five measures together save about 640 t CO₂ a year, or 20% of the baseline. I did not reach the 31% in the earlier version, because with consistent assumptions I could not reproduce it from these measures. Larger reductions would need more: fuel switching, heat recovery, a bigger solar system, or buying renewable electricity.
How Each Number Is Worked Out
For electricity measures, tonnes saved are kWh saved multiplied by the grid factor, and money saved is kWh saved multiplied by the tariff. For example, solar generating 490,000 kWh at 0.50 kg per kWh avoids 245 t, and at $0.10 per kWh saves $49,000. The 490,000 kWh assumes about 1,400 kWh per kWp a year; check the yield for your site.
For the boiler, an efficiency rise from 74% to 88% cuts the fuel needed for the same steam by 1 − 74/88, about 16%. I applied that to 600 t of the gas emissions, assuming the serviced boilers supply that part, at an assumed gas cost of $0.04 per kWh. The earlier version said an efficiency rise of that size saved 11% of gas, which is inconsistent. The compressed air saving depends on how much of the plant's electricity the compressors use, which an audit measures.
What the model shows
Without the solar system, the four operating measures cost about $43,000 and save about $79,284 a year in this model, a payback of about 0.5 years. Solar takes about 3.7 years. These are assumed figures. Real payback depends on your tariff, equipment and what an audit finds.
What Is Not Modelled
The earlier version claimed that two European customers renewed contracts because of the data, that a CDP Supply Chain score moved from C to B-, and that a brand offered cheaper financing. I removed these because they were invented outcomes for a composite factory. A supplier may see some of these benefits, but they are not guaranteed, and I have no evidence for how often they occur.
How To Measure It
Keep monthly electricity bills, fuel records, generation meter readings and production volumes in one file. Convert them using emission factors from a recognised source: your national grid factor for electricity, and the IPCC guidelines or your government's factors for fuels. Express the total per unit of product. Record the factors you used so that a customer or verifier can repeat the calculation.
Steps to build your own version
Collect twelve months of electricity, fuel and production data.
Commission an energy audit, or do a walk-through, to list leaks, idle running, old lighting and poorly maintained boilers.
For each measure, write the kWh or fuel saved, the cost and the saving using your own tariffs.
Convert savings to CO₂ with documented emission factors.
Rank measures by payback and do the cheap, quick ones first.
Keep the baseline and the method fixed so you can show the reduction year on year.
Frequently Asked Questions
Is this a real factory?
No. It is an illustrative model with assumed figures. An earlier version called itself a composite case study; I rebuilt it so that the assumptions are visible.
Can a factory cut emissions by 20–35% with efficiency measures alone?
Sometimes, depending on where it starts. I could not find a source for that range, so I do not claim it. The model here reaches about 20% with five measures and my assumptions.
Is solar worth it?
It depends on your tariff, roof, financing and net-metering rules. The model's payback of about 3.7 years is only as good as its assumed cost and yield.
Do customers reward emissions reductions?
Some ask for the data and some may favour suppliers who provide it. I have no figures on how often that leads to better terms.
References
No external sources were used for the figures in this article; all values are assumptions for illustration. Replace them with measurements from your own facility, and confirm emission factors with your national authority or the IPCC emission factor guidance.
Free tool · Sustainability Frisk
Want to calculate your factory carbon footprint?
Use the free Carbon Footprint Calculator — built for manufacturers, covers Scope 1 and 2.
Need a CSRD gap analysis or hands-on implementation? Sustainability Frisk can help. www.sustainability-frisk.com
Most brands estimate purchased-goods emissions from spend and averages. What that does to the numbers, what the CSRD and SBTi actually require, and what a supplier can provide.
How the EU ETS allowance price feeds into CBAM certificate prices, why price forecasts should be treated with caution, and what suppliers can do with the number.
 Carbon Chain Code