 Carbon Chain Code
CCC-SUS-006Sustainability/ESG
CSRD for Suppliers: Guide + Response Workbook
Practical CSRD guide and Excel workbook for manufacturers answering EU customer sustainability requests. Value chain cap, Annex II decoder, reply templates.
Brands are asking factories for product carbon footprints: per garment, per pair, per kilogram of fabric. ISO 14067 sets the rules for how they are calculated. This guide explains the decisions that matter, shows a worked textile example, and lists the mistakes that make a PCF unusable.
A product carbon footprint (PCF) is the greenhouse gas emissions of one specific product, expressed in kg CO₂e, across all or part of its life cycle. ISO 14067:2018 is the international standard for how to calculate and report one. It is not a management system standard and there is no ISO 14067 certificate. Conformance is shown through independent verification of the study. The 2018 edition is current, a revision is under way, and sources expect a version harmonised with the GHG Protocol product standard around 2027 to 2028. When a brand asks a factory for the carbon footprint of a product, this is the method it usually means, though some brands ask for another one, so always ask which.
The system boundary says which life cycle stages are counted. ISO 14067 covers a full cradle-to-grave footprint and also a partial CFP, which covers only selected stages, such as cradle-to-gate. Whatever you choose, you must state it, and you must state and explain any cut-off criteria. An exclusion is acceptable only if it does not significantly change the conclusions of the study.
For business-to-business requests, which is what a factory usually receives, cradle-to-gate is the common scope. It runs from raw material extraction to the point where the finished product leaves your site. The brand then adds distribution, use and end of life if it needs a full figure. A gate-to-gate figure, covering only your own manufacturing step, answers a different question from a cradle-to-gate figure, so if a request does not say which it wants, ask before you collect any data. How large the difference is depends on the product and on assumptions such as the number of washes, so do not use a general multiplier.
The functional unit is the quantity the result is expressed per. For a fabric mill it is usually 1 kg of finished fabric, or 1 linear metre at a stated width and weight. For a finished goods factory it is one unit of product. Define it precisely, for example one polyester knit sports shirt, size M, 150 g, specification version 2, rather than one shirt, because size and weight change the material content. Where only part of the life cycle is assessed, the standard also allows a declared unit.
Primary data is measured in your own process: energy bills, material weights, chemical use, production output. Secondary data comes from published databases or from suppliers' studies. The standard sets data quality requirements for time, geography and technology coverage, and for precision, completeness, representativeness, consistency and reproducibility, and it expects you to document sources and limitations. The usual approach for a factory is to use primary data for your own stage and the best available secondary data upstream, then replace secondary data with supplier data as it becomes available.
| Life cycle stage | Preferred data | Typical source |
|---|---|---|
| Raw fibre production | Secondary, or supplier data | LCI database (ecoinvent, LCA for Experts, EU EF datasets), published LCA by fibre and origin, or the Higg MSI as a materials screening tool |
| Spinning and yarn | Secondary, or primary if integrated | Supplier PCF or database process data |
| Weaving or knitting | Primary | Mill energy, water and output records ÷ kg of fabric |
| Wet processing (dyeing, finishing) | Primary | Energy, steam, water, chemicals and effluent treatment ÷ kg of fabric |
| Cut and sew, assembly | Primary | Factory energy ÷ units produced, plus material waste weight |
| Packaging | Primary or secondary | Material weight × material factor |
| Inbound transport | Primary or secondary | Tonne-km × mode factor; ISO 14083 and the GLEC Framework are the usual references |
If a facility makes several products, ISO 14067 follows the allocation hierarchy of ISO 14044. Avoid allocation where you can. Where you cannot, use physical relationships such as mass before other relationships such as price. For most textile factories this means allocation by the mass of product processed.
A practical example is a dyeing machine that runs three colours in one day when only one fabric is being assessed. Allocate the machine's energy by the weight of fabric processed in the relevant period. If the assessed fabric was 30% of the machine's output that month, it carries 30% of that month's energy. This needs production records by machine, not just by site.
Natural fibres such as cotton and wool and man-made cellulosics carry biogenic carbon. ISO 14067 has specific rules for biogenic carbon, land use change and electricity, and biogenic carbon stored in the product is reported separately rather than netted off. Offsets are not part of a CFP. State the global warming potential values you used, including which IPCC assessment report they come from, because the figures change between reports. I have not checked the exact clause wording, so confirm it in your copy of the standard.
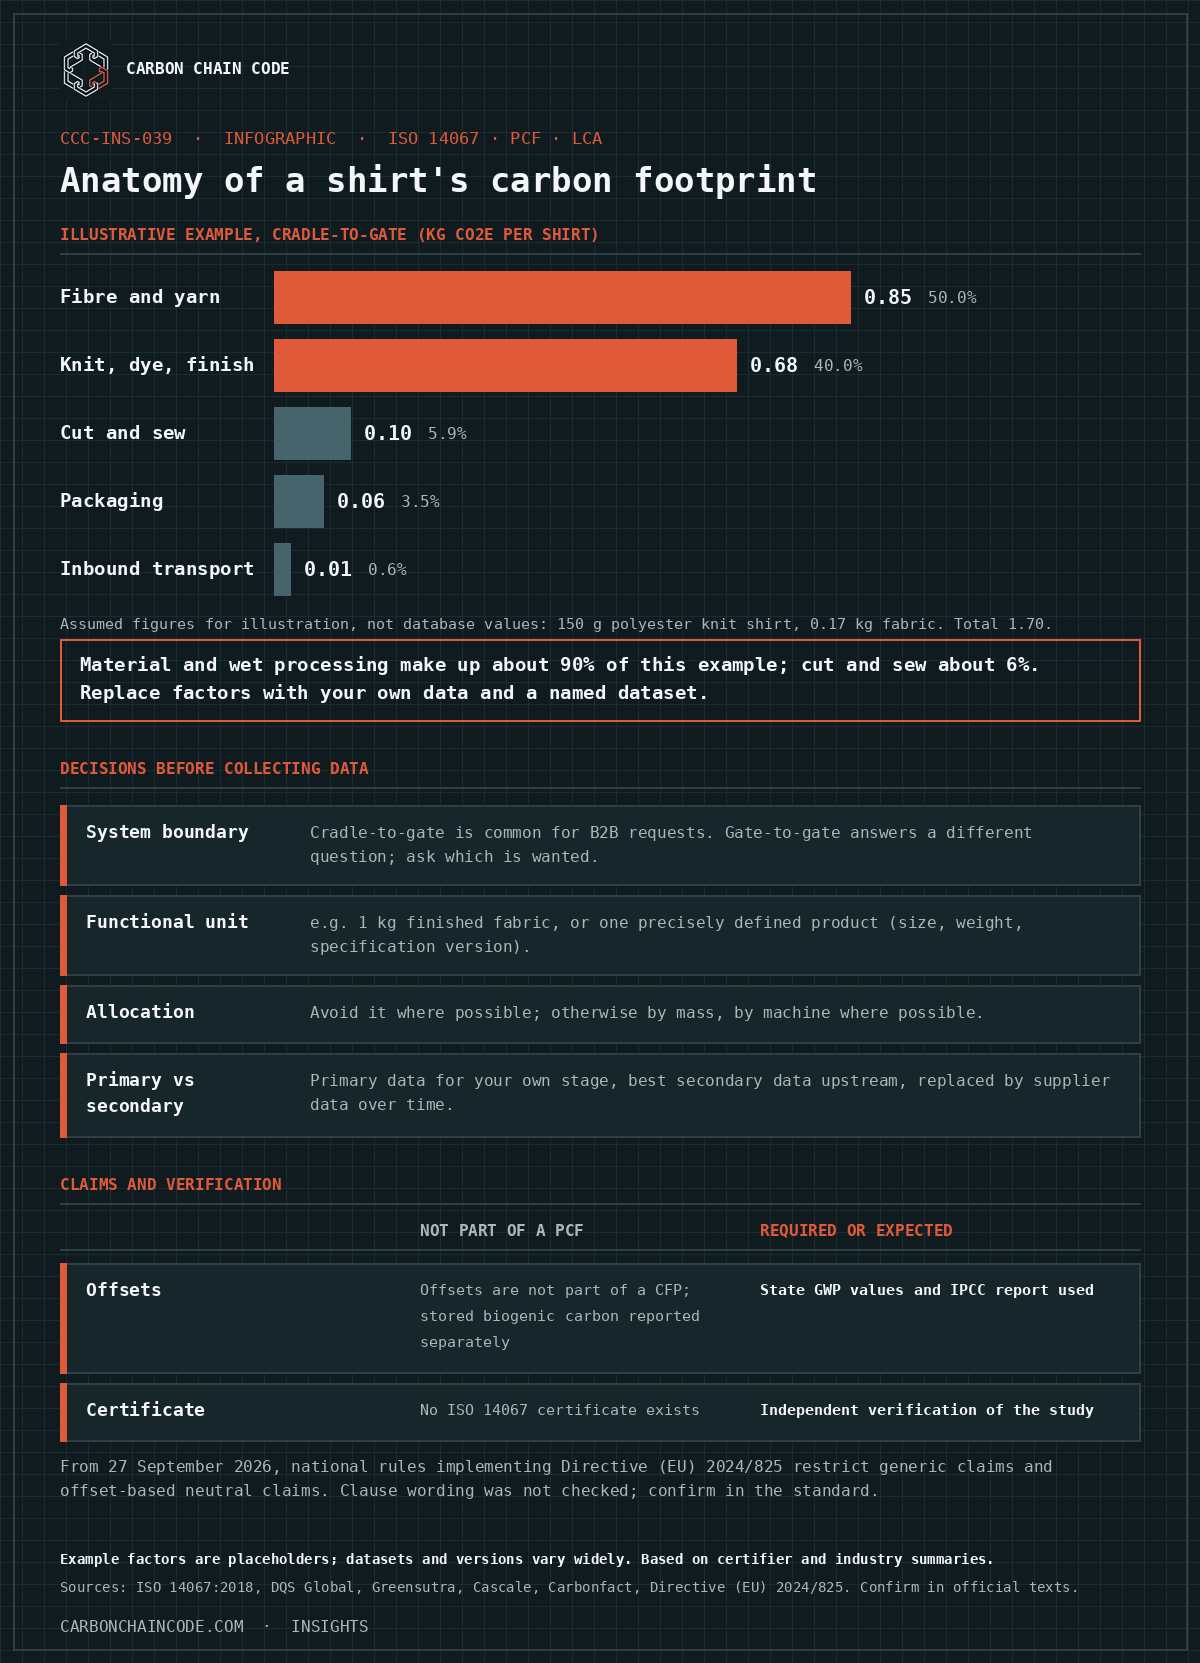
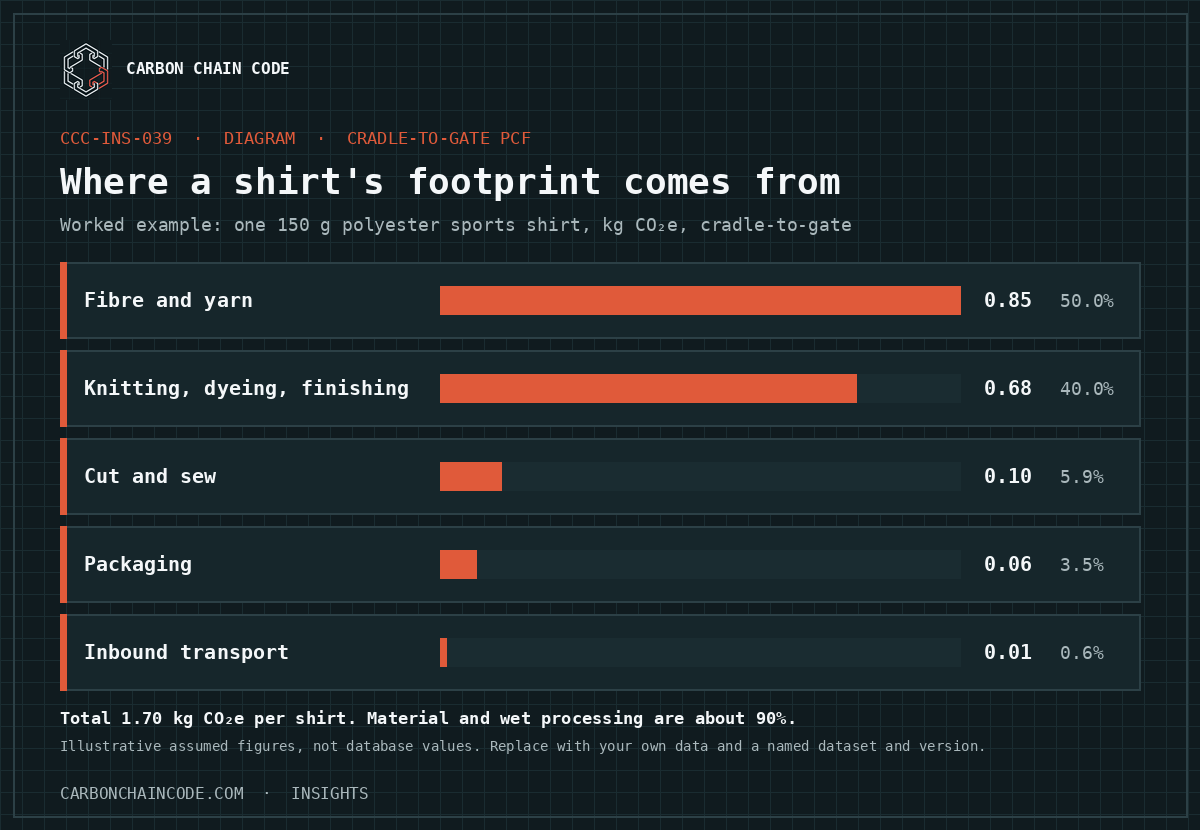
The figures below are assumed for illustration. They are not database values and must be replaced with your own data and a named dataset and version. Functional unit: one polyester knit sports shirt, finished weight 150 g. Fabric used is 0.17 kg, which allows for cutting waste.
| Stage | Calculation | kg CO₂e per shirt | Share |
|---|---|---|---|
| Fibre and yarn | 0.17 kg fabric × 5.0 kg CO₂e/kg | 0.85 | 50.0% |
| Knitting, dyeing, finishing | 0.17 kg fabric × 4.0 kg CO₂e/kg | 0.68 | 40.0% |
| Cut and sew | Factory energy ÷ shirts produced | 0.10 | 5.9% |
| Packaging | Polybag and tag, weight × factor | 0.06 | 3.5% |
| Inbound transport | Tonne-km × mode factor | 0.01 | 0.6% |
| Cradle-to-gate total | 1.70 | 100.0% |
In this example the material stage and wet processing together make up about 90% of the cradle-to-gate result, while cut and sew is about 6%. That pattern is common in apparel, and it is why a factory should look first at its fabric and wet-processing data, because a brand will read those lines hardest. The factors above are placeholders. One 2026 industry summary cites about 3 kg CO₂e per kg for virgin PET polymer alone in recent datasets, before spinning and texturising, and dataset versions differ, so values for fibre, recycled routes and fabric vary widely between sources and versions.
Standard: ISO 14067:2018, Greenhouse gases: carbon footprint of products. Edition confirmed by ISO in 2024, revision in progress. Not certifiable: conformance is shown through independent verification. Higg MSI: owned by Cascale (formerly the Sustainable Apparel Coalition) and hosted on Worldly. Version 3.11 (November 2025) realigned scores to updated background data, and Cascale says changes of around ±10% can be expected, so record the version you used. Environmental claims in the EU: Directive (EU) 2024/825 rules apply from 27 September 2026.
External communication rests on a PCF study report. As described by certification bodies, the report documents the product and functional unit, the system boundary, the methodology and data sources, the assumptions including allocation and cut-off, the results, and a data quality assessment. A critical review is optional and, if done, follows ISO/TS 14071. Where independent verification of the greenhouse gas statement is wanted, it is carried out under ISO 14064-3 by a body that did not prepare the study. A bare figure such as 1.7 kg CO₂e per shirt, without this context, cannot be compared with any other PCF.
Be careful with claims. From 27 September 2026, national rules implementing Directive (EU) 2024/825 restrict generic environmental claims and claims that a product is neutral, reduced or positive in its impact based on offsetting. A PCF figure is a measured quantity, so state it with its boundary and unit, and talk to your buyer's legal team before using any claim in marketing.
PCF checklist for a factory
No. ISO 14067 builds on life cycle assessment methods (ISO 14040 and 14044) but covers only one impact category, climate change, expressed in CO₂e. A full LCA assesses several impact categories, such as water use, land use and eutrophication. If a brand asks for a PCF it wants a greenhouse gas figure. If it asks for an LCA or a full environmental footprint it wants more than that.
There is no ISO 14067 certificate, and conformance is shown through independent verification of the study. A calculation done following the standard without verification can still be useful for internal decisions and early buyer reporting, but you should not describe it as verified. Many buyers now ask for verification for material suppliers, so ask what yours expects.
The Higg Materials Sustainability Index is a material-level assessment tool. Cascale, formerly the Sustainable Apparel Coalition, owns it, and it is hosted on Worldly. It can give you impact values for common textile materials when you have no better data, but its scores are not a PCF. Version changes can move results by around 10%, so record the version, and treat it as secondary data to be replaced by supplier data.
Offsets are not part of a CFP under ISO 14067. In the EU, claims that a product is neutral, reduced or positive in its impact based on offsetting are restricted by rules implementing Directive (EU) 2024/825 from 27 September 2026. Report the measured footprint and handle claims with your buyer's legal team.
ISO 14067:2018, Greenhouse gases: carbon footprint of products. DQS Global, ISO 14067 explained (dqsglobal.com). Greensutra, What does ISO 14067 require for a product carbon footprint. Cascale, Higg MSI v3.11 press release (29 October 2025). Carbonfact, The Carbon Footprint of Polyester. Directive (EU) 2024/825 on empowering consumers for the green transition. I used certifier and industry summaries, not the full standard text, so confirm specific clauses in the standard before relying on them.
Free tool · Sustainability Frisk
Want to calculate your factory carbon footprint?
Use the free Carbon Footprint Calculator — built for manufacturers, covers Scope 1 and 2.
Need a CSRD gap analysis or hands-on implementation? Sustainability Frisk can help. www.sustainability-frisk.com
Practical CSRD guide and Excel workbook for manufacturers answering EU customer sustainability requests. Value chain cap, Annex II decoder, reply templates.
Brands are moving from spend-based Scope 3 estimates to supplier-specific data. Here is what they are asking for, how the four GHG Protocol calculation methods differ, and what a factory needs to build to answer.

ISO 14001 tells you to set an environmental objective. Six Sigma's DMAIC gives you a structured method to reach it. Here is how each phase maps to a Scope 1 and Scope 2 carbon reduction project, with an illustrative worked example.